Green Spot
Green Spot
[UX/UI Design]
[UX/UI Design]
[Geo-located AR Mobile Game] [2024]
[Geo-located AR Mobile Game] [2024]
Overview
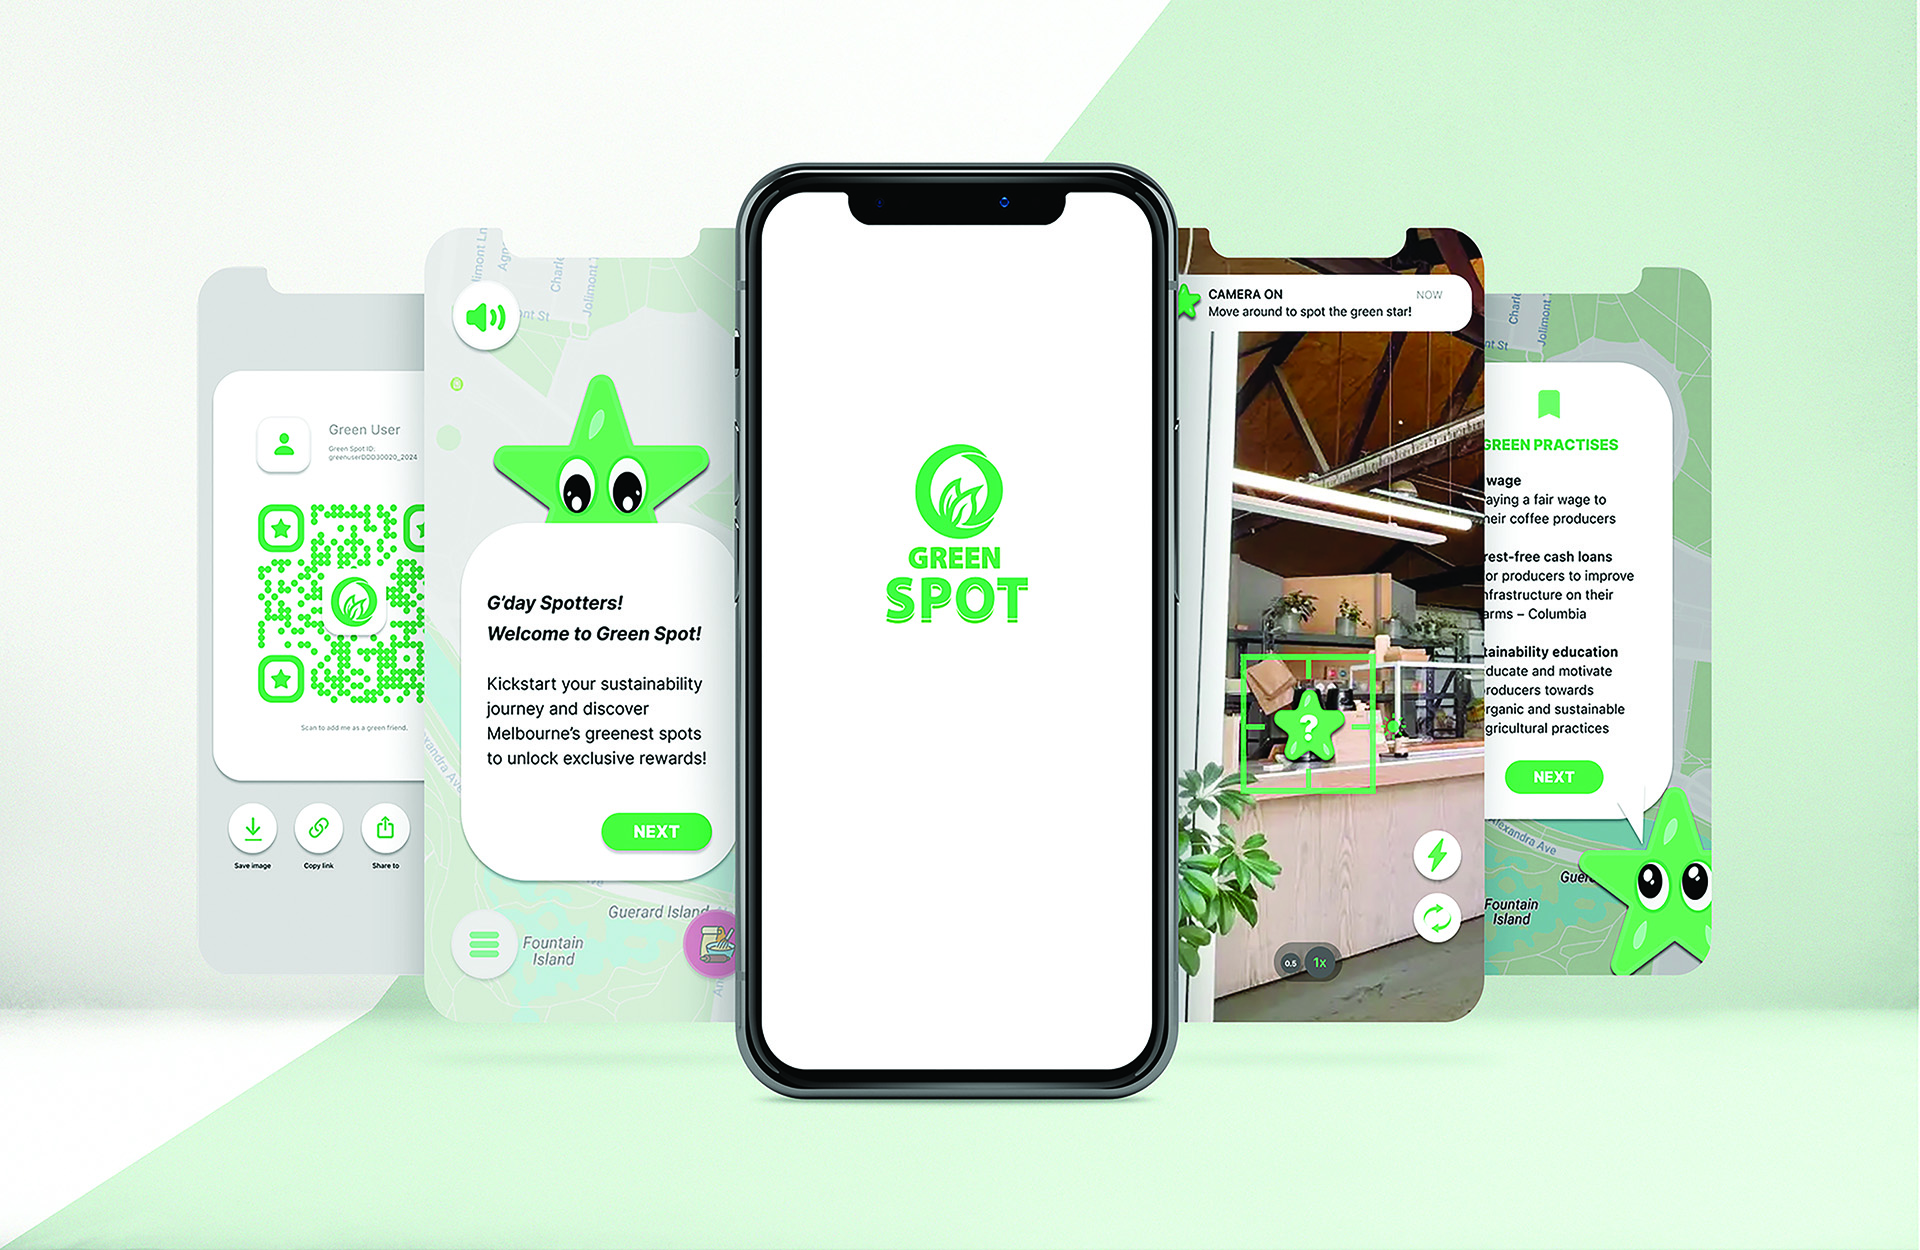
A narrative-driven mobile game using simulated geolocation, AR, camera, and audio, where users explore ten Melbourne’s curated spots, collect ‘green stars,’ and unlock rewards while discovering sustainability initiatives.
Problem
Melbourne’s cafés, restaurants, and landmarks embrace sustainability, but users often overlook it — this project engages and educates through interactive experiences.
Solution
Challenge
Melbourne’s cafés, restaurants, and landmarks embrace sustainability, but users often overlook it — this project engages and educates through interactive experiences.
A narrative-driven mobile game using AR and simulated geolocation to guide users through ten curated Melbourne spots, earning green stars while discovering sustainability initiatives.
Softwares Used
Figma
Adobe Stock
Adobe Illustrator
Role
UX/UI Designer
Project Duration
12 weeks
Stage 01 :
Who we are designing for
Stage 01 :
Who we are designing for
I used focus groups to uncover user experiences with geo-location apps and AR, creating personas and storyboards to visualise interactions and guide improvements.
I used focus groups to uncover user experiences with geo-location apps and AR, creating personas and storyboards to visualise interactions and guide improvements.
"I use geolocation apps every day, like 'PTV' when I had to catch the train this morning to go to class."
"I like geolocation apps because I can connect with my friends and discover new places on Instagram."
"I have tried AR technology with Pokémon Go. I am very introverted, and this mobile game helped me to get outside to socialise."
"The geolocated apps I use are pretty simplified and easy to navigate. They look the same as every other map."
"I usually find cafes on my Instagram explore page, check the tagged location for details, and if it looks appealing, I add them to my visit list."
[Focus Group Interview Results]
[Focus Group Interview Results]
Key findings in usage
Key findings in usage
100%
Used geolocation apps daily
100%
Used geolocation apps daily
83%
Used geolocation apps to discover new places
83%
Used geolocation apps to discover new places
67%
Used geolocation apps for socialising
67%
Used geolocation apps for socialising
Brief Requirements
Brief Requirements
User Needs
User Needs
Explore 10 Locations
Connect digital with real-world
Explore 10 Locations
Connect digital with real-world
Playing Incentive
Encourage user/s to participate
Playing Incentive
Encourage user/s to participate
Easy Navigation
Clean & simple interface
Easy Navigation
Clean & simple interface
Discover New Places
Explore different locations
Discover New Places
Explore different locations
Family Connection
Social feature to share & connect
Family Connection
Social feature to share & connect
Simulated AR
Create an immersive experience
Simulated AR
Create an immersive experience
[Common User Needs from Qualitative Analysis VS. Brief Requirements]
[Common User Needs from Qualitative Analysis
VS. Brief Requirements]
Target Users
Target Users
Melbourne locals and tourists aged 18–40 who enjoy uncovering new city experiences and actively supporting local businesses.
Melbourne locals and tourists aged 18–40 who enjoy uncovering new city experiences and actively supporting local businesses.

Visual Identity
Researched and iterated the logo and visual identity, renaming the app from ‘Sweet Spot’ to ‘Green Spot’ to emphasise its sustainability focus.


Primary Logo

Secondary Logo

App Icon Logo
Primary Logo
Secondary Logo
App Icon Logo
Primary Logo
Secondary Logo
App Icon Logo
Primary Logo
Secondary Logo
App Icon Logo
Logo Experiments

Experimented with designs inside the ‘location pin’ but found them cluttered, so I removed the inner circle and refined the logo using only that element for a cleaner, stronger and successful design.

Kept ‘spot’ in a larger type and explored different layouts with the symbols from the previous page, refining the final logo colour to a softer green after earlier versions appeared yellow and dull.
Logo Experiments
Logo Experiments
Experimented with designs inside the ‘location pin’ but found them cluttered, so I removed the inner circle and refined the logo using only that element for a cleaner, stronger and successful design.
Kept ‘spot’ in a larger type and explored different layouts with the symbols from the previous page, refining the final logo colour to a softer green after earlier versions appeared yellow and dull.
Logo Experiments
Stage 02 :
Design development
Stage 02 :
Design development
Turning insights into wireframes and prototypes, then refining them through observed behaviours and usability-test feedback to enhance clarity, flow, and usability.
Turning insights into wireframes and prototypes, then refining them through observed behaviours and usability-test feedback to enhance clarity, flow, and usability.
Flow Chart of Interactions


Storyboard of User Journey

Wireframe of Main Screens
User Testing:
Design Evaluation
User Testing:
Design Evaluation
I conducted field testing on Prototype 1.0, gathering insights through pre- and post-test forms, observation, and participant feedback.
Using qualitative analysis and Jakob Nielsen’s 10 Usability Heuristics, I translated these findings into UX-driven refinements that shaped Prototype 2.0.
I conducted field testing on Prototype 1.0, gathering insights through pre- and post-test forms, observation, and participant feedback.
Using qualitative analysis and Jakob Nielsen’s 10 Usability Heuristics, I translated these findings into UX-driven refinements that shaped Prototype 2.0.
LOCATION SPOTTED
Prototype 1.0

No 'Back' button – users can only proceed through green star interaction
Problem from Usability Tests:
LOCATION SPOTTED
Prototype 2.0

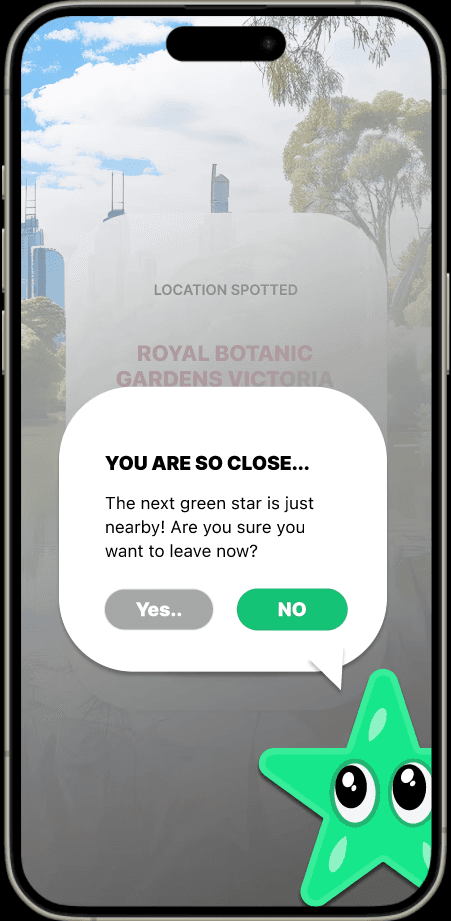
Added ‘back’ button - Improving navigation on all the ‘Location Spotted’ screens
Improvements made:
Exit confirmation - Back action requires confirmation via pop-up
TEXT-TO-SPEECH BUTTON
Prototype 1.0

Text-to-speech button - only available on introduction screens
Problem from Usability Tests:
TEXT-TO-SPEECH BUTTON
Prototype 2.0
Added text-to-speech – mascot narration across sustainability screens
Improvements made:
Enhances accessibility and on-the-go listening – reduces content skipping (field test insight)
PROFILE
Prototype 1.0
Inconsistent layout – misaligned elements reduce clarity
Problem from Usability Tests:
No ‘Share Profile’ option – field test suggested desire to connect with friends and family
PROFILE
Prototype 2.0

Auto-generated Green Spot IDs – enable instant play, circular level icons – enhance visual clarity
Improvements made:
Added 'Share to' button & QR code scanner - simplify adding ‘green friends’
FAVOURITES
Prototype 1.0

No save locations option – user cannot revisit their favourite locations, reducing engagement
Problem from Usability Tests:
FAVOURITES
Prototype 2.0

Bookmark icon added – flag key info/location in ‘Green Practices’ before returning to map
Improvements made:
Locations auto-bookmarked – removable via icon, supporting easy revisits and user control
LOCATION SPOTTED
Prototype 1.0
No 'Back' button – users can only proceed through green star interaction
Problem from Usability Tests:
LOCATION SPOTTED
Prototype 2.0
Added ‘back’ button - Improving navigation on all the ‘Location Spotted’ screens
Improvements made:
Exit confirmation - Back action requires confirmation via pop-up
TEXT-TO-SPEECH BUTTON
Prototype 1.0
Text-to-speech button - only available on introduction screens
Problem from Usability Tests:
TEXT-TO-SPEECH BUTTON
Prototype 2.0
Added text-to-speech – mascot narration across sustainability screens
Improvements made:
Enhances accessibility and on-the-go listening – reduces content skipping (field test insight)
PROFILE
Prototype 1.0
Inconsistent layout – misaligned elements reduce clarity
Problem from Usability Tests:
No ‘Share Profile’ option – field test suggested desire to connect with friends and family
PROFILE
Prototype 2.0
Auto-generated Green Spot IDs – enable instant play, circular level icons – enhance visual clarity
Improvements made:
Added 'Share to' button & QR code scanner - simplify adding ‘green friends’
FAVOURITES
Prototype 1.0
No save locations option – user cannot revisit their favourite locations, reducing engagement
Problem from Usability Tests:
FAVOURITES
Prototype 2.0
Bookmark icon added – flag key info/location in ‘Green Practices’ before returning to map
Improvements made:
Locations auto-bookmarked – removable via icon, supporting easy revisits and user control
No 'Back' button – users can only proceed through green star interaction
Added ‘back’ button - Improving navigation on all the ‘Location Spotted’ screens
Exit confirmation - Back action requires confirmation via pop-up
Prototype 1.0
Prototype 2.0
Improvements made:
Problem from Usability Tests:
Location Spotted
Text-to-speech button - only available on introduction screens
Added text-to-speech – mascot narration across sustainability screens
Enhances accessibility and on-the-go listening – reduces content skipping (field test insight)
Prototype 1.0
Prototype 2.0
Improvements made:
Problem from Usability Tests:
Text-to-Speech Button
Inconsistent layout – misaligned elements reduce clarity
No ‘Share Profile’ option – field test suggested desire to connect with friends and family
Auto-generated Green Spot IDs – enable instant play, circular level icons – enhance visual clarity
Added 'Share to' button & QR code scanner - simplify adding ‘green friends’
Prototype 1.0
Prototype 2.0
Improvements made:
Problem from Usability Tests:


Profile
No save locations option – user cannot revisit their favourite locations, reducing engagement
Bookmark icon added – flag key info/location in ‘Green Practices’ before returning to map
Locations auto-bookmarked – removable via icon, supporting easy revisits and user control
Prototype 1.0
Prototype 2.0
Improvements made:
Problem from Usability Tests:

Favourites
No 'Back' button – users can only proceed through green star interaction
Added ‘back’ button - Improving navigation on all the ‘Location Spotted’ screens
Exit confirmation - Back action requires confirmation via pop-up
Prototype 1.0
Prototype 2.0
Improvements made:
Problem from Usability Tests:
Location Spotted
Text-to-speech button - only available on introduction screens
Added text-to-speech – mascot narration across sustainability screens
Enhances accessibility and on-the-go listening – reduces content skipping (field test insight)
Prototype 1.0
Prototype 2.0
Improvements made:
Problem from Usability Tests:
Text-to-Speech Button
Inconsistent layout – misaligned elements reduce clarity
No ‘Share Profile’ option – field test suggested desire to connect with friends and family
Auto-generated Green Spot IDs – enable instant play, circular level icons – enhance visual clarity
Added 'Share to' button & QR code scanner - simplify adding ‘green friends’
Prototype 1.0
Prototype 2.0
Improvements made:
Problem from Usability Tests:
Profile
No save locations option – user cannot revisit their favourite locations, reducing engagement
Bookmark icon added – flag key info/location in ‘Green Practices’ before returning to map
Locations auto-bookmarked – removable via icon, supporting easy revisits and user control
Prototype 1.0
Prototype 2.0
Improvements made:
Problem from Usability Tests:
Favourites
Stage 03 :
Final Design
Stage 03 :
Final Design
At the final iteration, I tested the prototype with a second focus group to assess the user experience. Their insights shaped future design recommendations.
At the final iteration, I tested the prototype with a second focus group to assess the user experience. Their insights shaped future design recommendations.
WELCOME TO GREEN SPOT
Key Features:
Tutorial
Tutorial appears automatically
Simulated location tracking
Simulated location tracking
Location pin appears
'Nearby' notification
SPOTTING GREEN STAR
Simulated camera / AR
Move around notification
Spot the 'green star' to reveal AR ingredients
Simulated location tracking
Info automatically bookmarked
Key Features:
LEVEL COMPLETED
Video element
Baking video used as loading screen
Recipe button
View progress via the recipe button
Green star fills on ingredient collection
Key Features:
REDEEM REWARD
Rewards button
Tutorial guides users to rewards page after unlocking a voucher
Redeem function
Reward code issued for redemption
Reward notification – active with countdown
Key Features:
PROFILE - LEVEL COMPLETED
Switching tabs
Slide transition between ‘Mission’ and ‘Favourites’
Scroll
Scroll to view completed levels and favourites
Key Features:
SHARE WITH FRIENDS
Scan QR code
Simulated QR scan to add friends quickly
Share to feature
QR code sharing with confirmation notification, also available on the 'Green Leaderboard'
Key Features:
Tutorial
Tutorial appears automatically
Simulated location tracking
Simulated location tracking
Location pin appears
'Nearby' notification
Key Features:
WELCOME TO GREEN SPOT
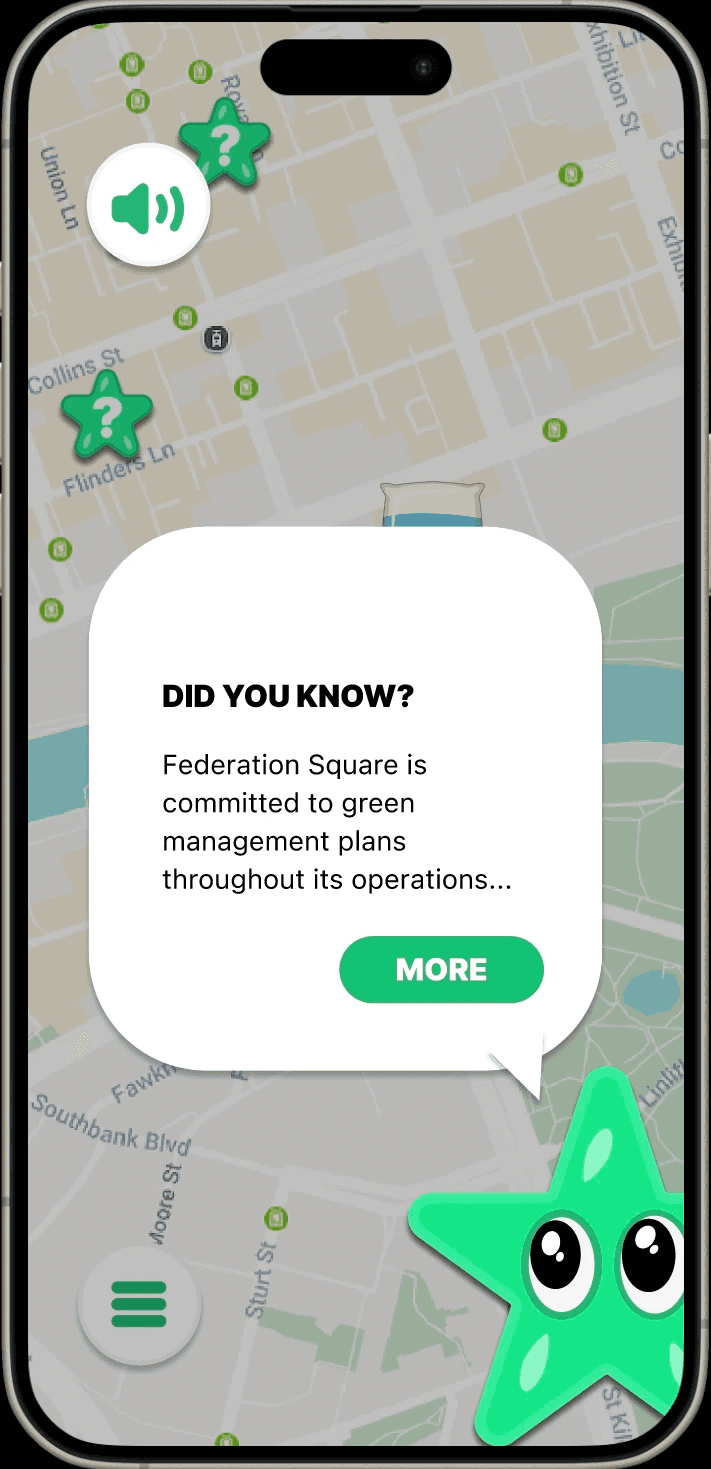
Simulated camera / AR
Notification prompting users to move around
Spot the 'green star' to reveal the ingredient in AR
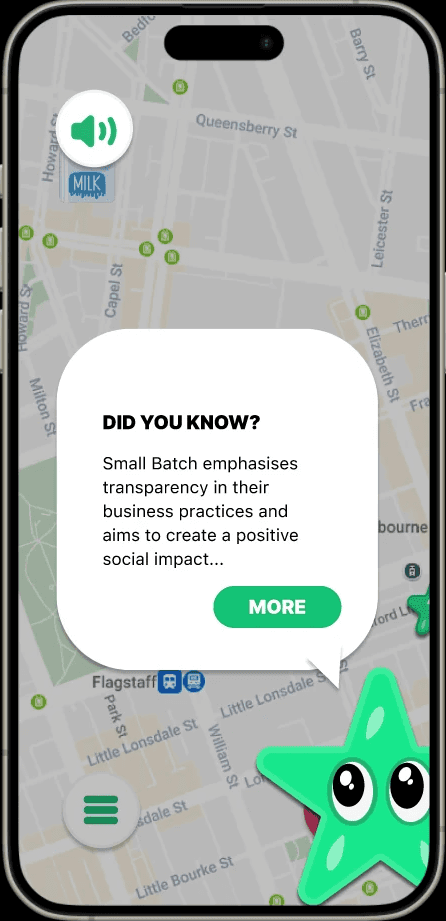
Green Practices
Information is automatically bookmarked
Key Features:
SPOTTING GREEN STAR
Video element
Baking video is used as a loading screen
Recipe button
Progress is viewable via the bottom-right recipe button
The green star fills after the ingredient is collected.
Key Features:
LEVEL COMPLETED
Rewards button
Tutorial guides users to the rewards page after they unlock a voucher
Redeem function
Users receive a unique code to redeem the reward
Notification indicates the reward is active and the expiry countdown has begun
Key Features:
REDEEM REWARD
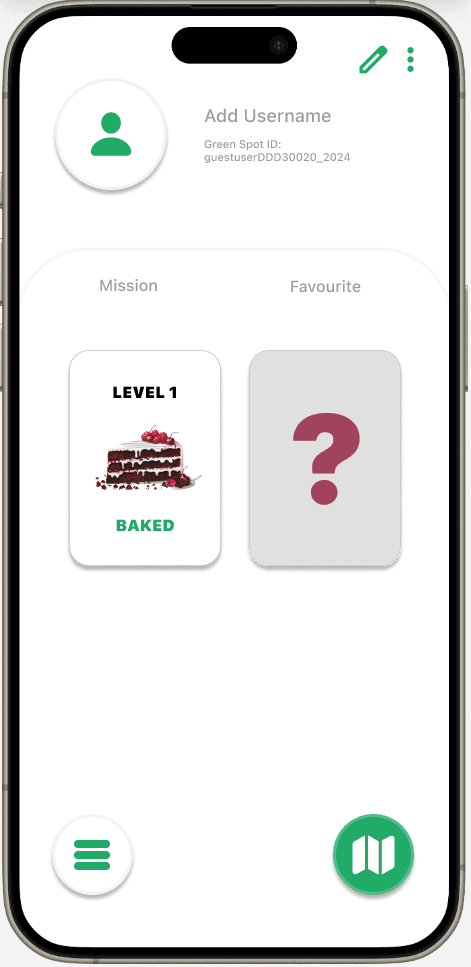
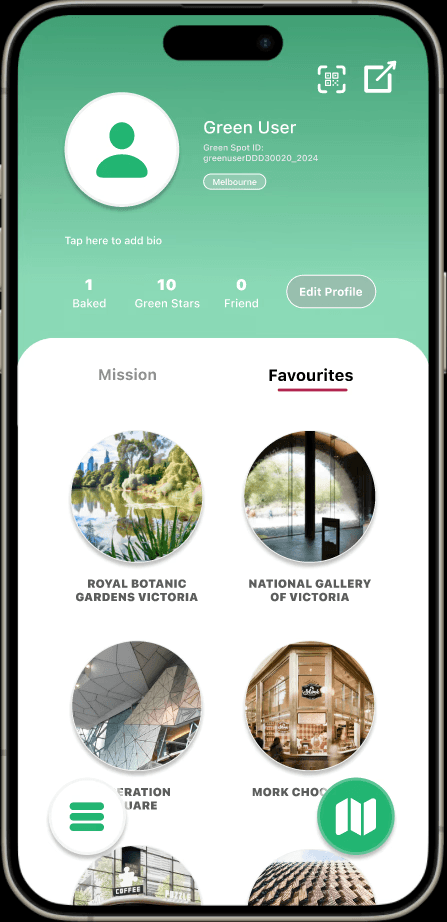
Tabs
Sliding transition between ‘Mission’ and ‘Favourites'
Scroll
Scroll through levels and favourited locations
Key Features:
PROFILE - LEVEL COMPLETED
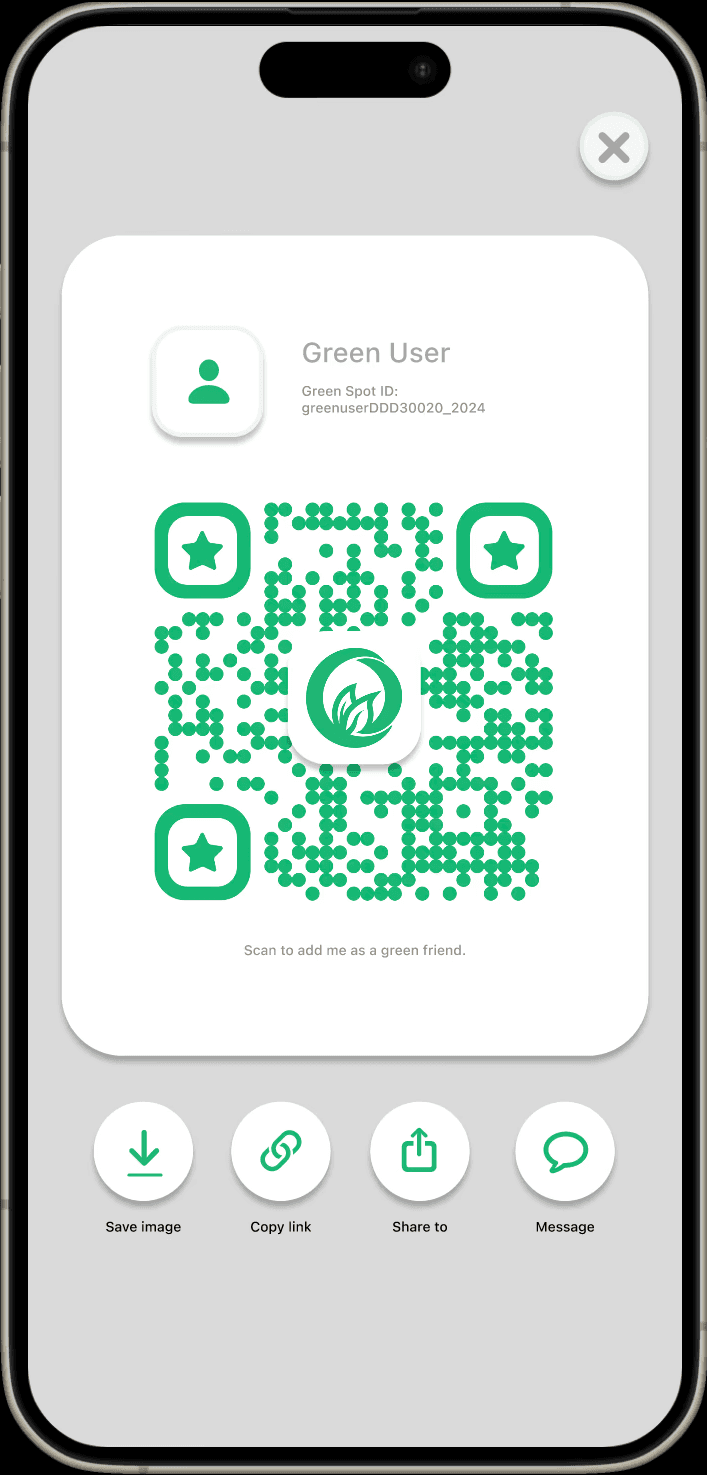
Scan QR code
Simulated QR scanning screen to quickly add friends
Share to
Unique QR code with sharing options; notification confirms share or save
Same share feature on ‘Green Leaderboard’ to invite friends
Key Features:
SHARE WITH FRIENDS
Tutorial
Tutorial appears automatically
Simulated location tracking
Simulated location tracking
Location pin appears
'Nearby' notification
Key Features:
WELCOME TO GREEN SPOT
Simulated camera / AR
Notification prompting users to move around
Spot the 'green star' to reveal the ingredient in AR
Green Practices
Information is automatically bookmarked
Key Features:
SPOTTING GREEN STAR
Video element
Baking video is used as a loading screen
Recipe button
Progress is viewable via the bottom-right recipe button
The green star fills after the ingredient is collected.
Key Features:
LEVEL COMPLETED
Rewards button
Tutorial guides users to the rewards page after they unlock a voucher
Redeem function
Users receive a unique code to redeem the reward
Notification indicates the reward is active and the expiry countdown has begun
Key Features:
REDEEM REWARD
Tabs
Sliding transition between ‘Mission’ and ‘Favourites'
Scroll
Scroll through levels and favourited locations
Key Features:
PROFILE - LEVEL COMPLETED
Scan QR code
Simulated QR scanning screen to quickly add friends
Share to
Unique QR code with sharing options; notification confirms share or save
Same share feature on ‘Green Leaderboard’ to invite friends
Key Features:
SHARE WITH FRIENDS
Stage 04 :
Reflection
Stage 04 :
Reflection
After completing the final prototype, I reflected on the end-to-end design process and how each research and testing method shaped the final outcome.
After completing the final prototype, I reflected on the end-to-end design process and how each research and testing method shaped the final outcome.
During development, I used Figma variables to create seamless interactions, like transforming green stars into collected ingredient icons, and experimented with animations, QR scanner slides and notifications drop, to enhance interactivity.
Insights from field tests, questionnaires, and focus groups informed my design decisions and updates. Overall, the app functions well, though the interface and visual design could be further refined with more time.